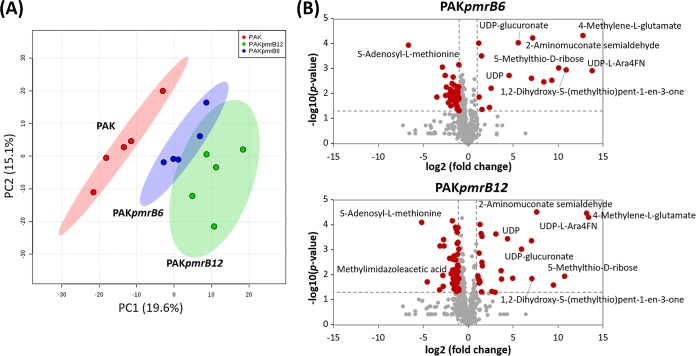
FIG 4.
Multivariate and univariate statistical analyses of metabolic perturbations between wild-type PAK and the pmrB mutants, PAKpmrB6 and PAKpmrB12. (A) PCA score plots of the two principle components for metabolite levels from the three strains: red, PAK; blue, PAKpmrB6; green, PAKpmrB12. (B) Volcano plots show the fold change and significance of metabolites in both pmrB mutants compared to the wild-type strain. Red plots represent metabolites having a fold change of >2 and a P value of <0.05 (Student's t test), while gray plots represent metabolites that are not significantly changed. Fold changes relative to the untreated control are based upon mean values from five biological replicates in all three strains.

