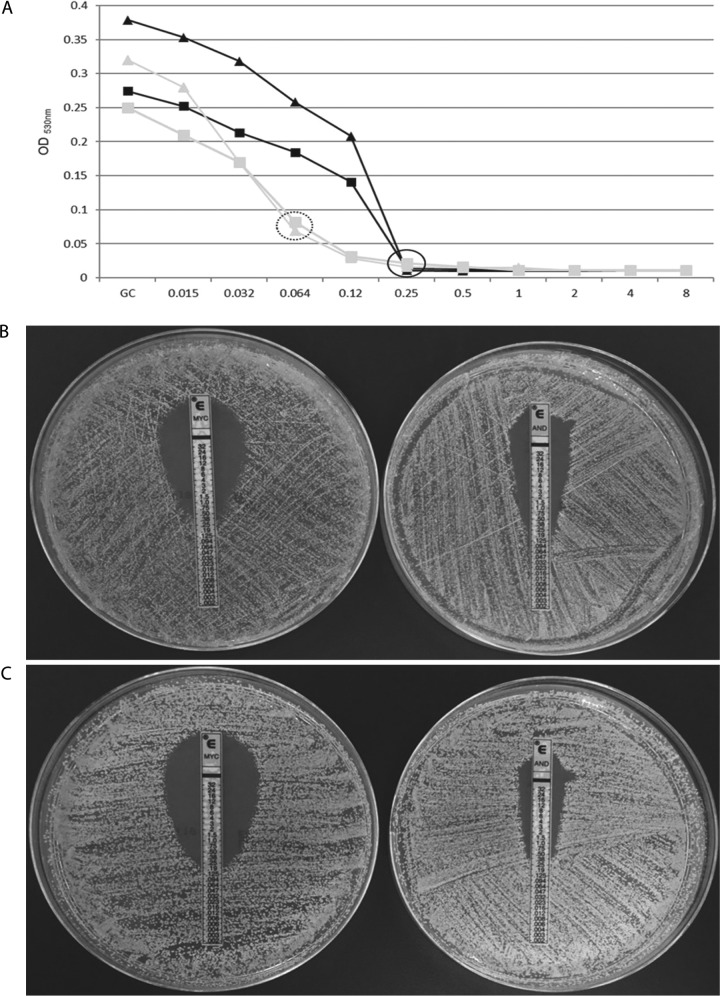
FIG 1.
(A) Echinocandin growth inhibition curves obtained by the EUCAST method indicating resistance to micafungin (black) but susceptibility to anidulafungin (grey) for C. tropicalis isolates with R647G (triangles) or F641L (squares) mutations. Black circle indicates micafungin MIC; dotted circle indicates anidulafungin MIC; GC, growth control. ETDIR of two C. tropicalis isolates with R647G (B) and F641L (C) mutations indicating resistance to both echinocandins. MYC, micafungin; AND, anidulafungin.

