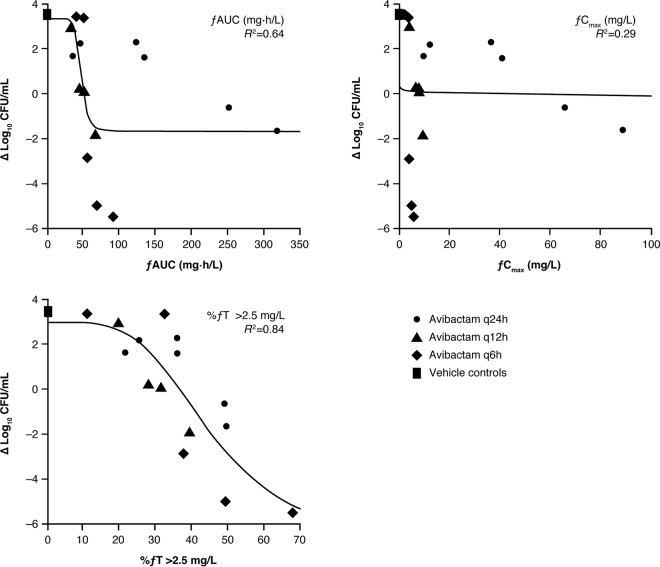
FIG 3.
PK/PD relationship between fAUC, fCmax, and %fT>CT for avibactam in the presence of fixed dosing of aztreonam against an E. coli strain in the hollow-fiber model. Symbols represent experimental observations for different dosage regimens of avibactam and continuous lines represent the predicted best-fit model. Republished from reference 49 with permission from the British Society for Antimicrobial Chemotherapy.

