
FIG 1.
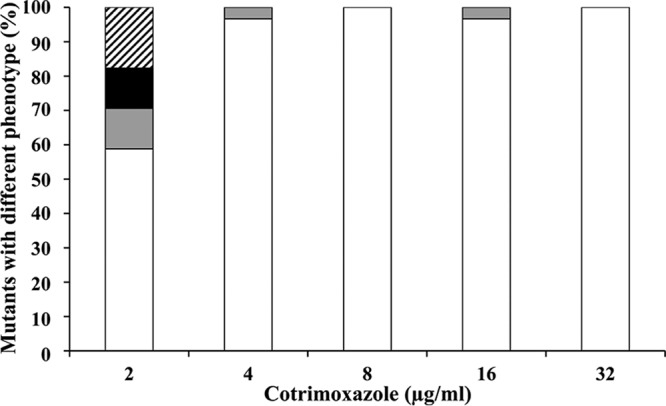
Phenotypes of mutants selected at different co-trimoxazole concentrations. The percentages of each category of mutants selected at each co-trimoxazole concentration are shown. White bars, mutants with chloramphenicol and quinolone resistance; gray bars, mutants with quinolone resistance; black bars, mutants with erythromycin and quinolone resistance; striped bars, mutants with erythromycin, chloramphenicol, and quinolone resistance.