FIG 4.

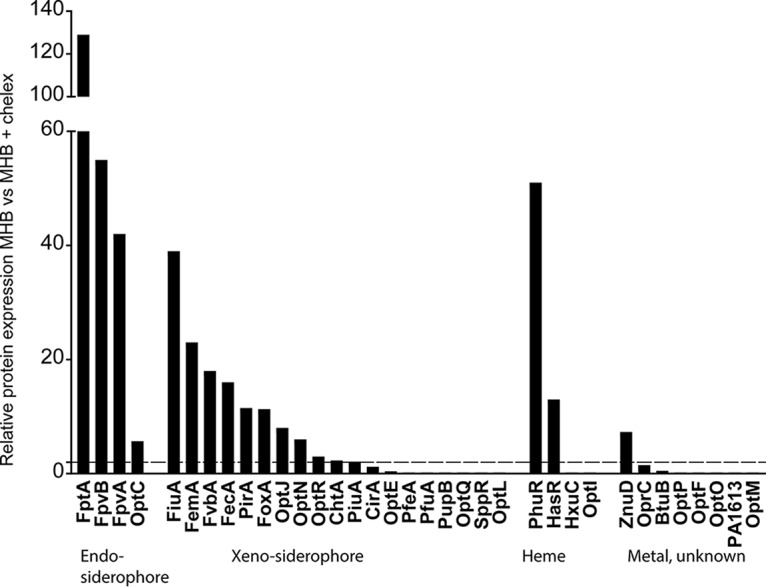
Proteomic analysis of TBDRs from P. aeruginosa PAO1. Protein expression levels were compared between cells grown for 20 h in MHB or Chelex-treated MHB. The dashed line indicates the 2-fold induction threshold level.

Proteomic analysis of TBDRs from P. aeruginosa PAO1. Protein expression levels were compared between cells grown for 20 h in MHB or Chelex-treated MHB. The dashed line indicates the 2-fold induction threshold level.