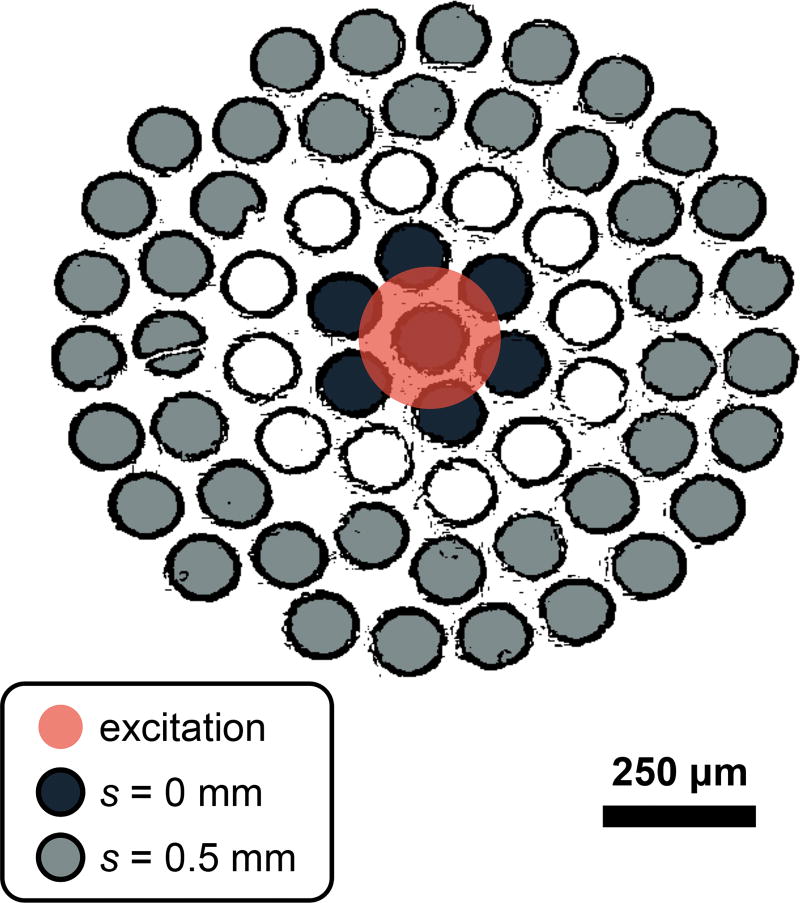
Figure 2.
Fiber bundle diagram depicting the relationship between the excitation spot and the collection regions (s = 0 and s = 0.5 mm) on the surface of the sample. The diagram was generated by applying an edge detection filter to a white-light image of the fiber bundle face. Note that only signal from 40 of the total 61 optical fibers were detected due to the limited height of the CCD camera.

