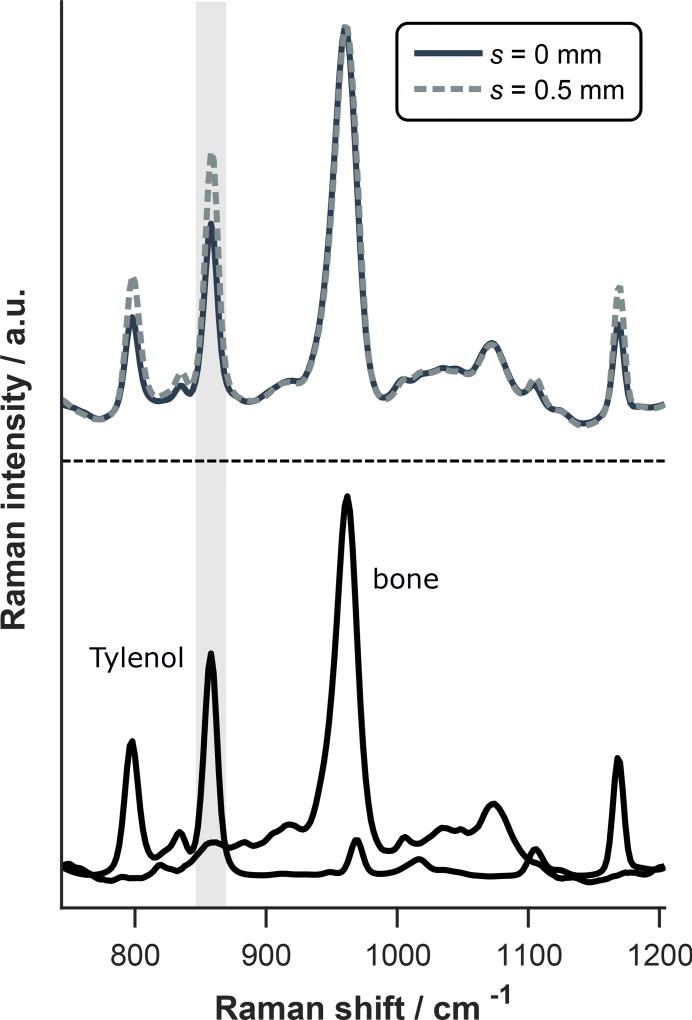
Figure 3.
(top) Raman spectra of two-layer bone and Tylenol sample acquired at different spatial offsets and each normalized to the phosphate peak near 960 cm−1. Spectra of cortical bone and Tylenol alone are also included for comparison (bottom). Note that the relative signal from the lower (Tylenol) layer is larger at s = 0.5 mm as highlighted by the gray column indicating greater sensitivity to the subcortical space.

