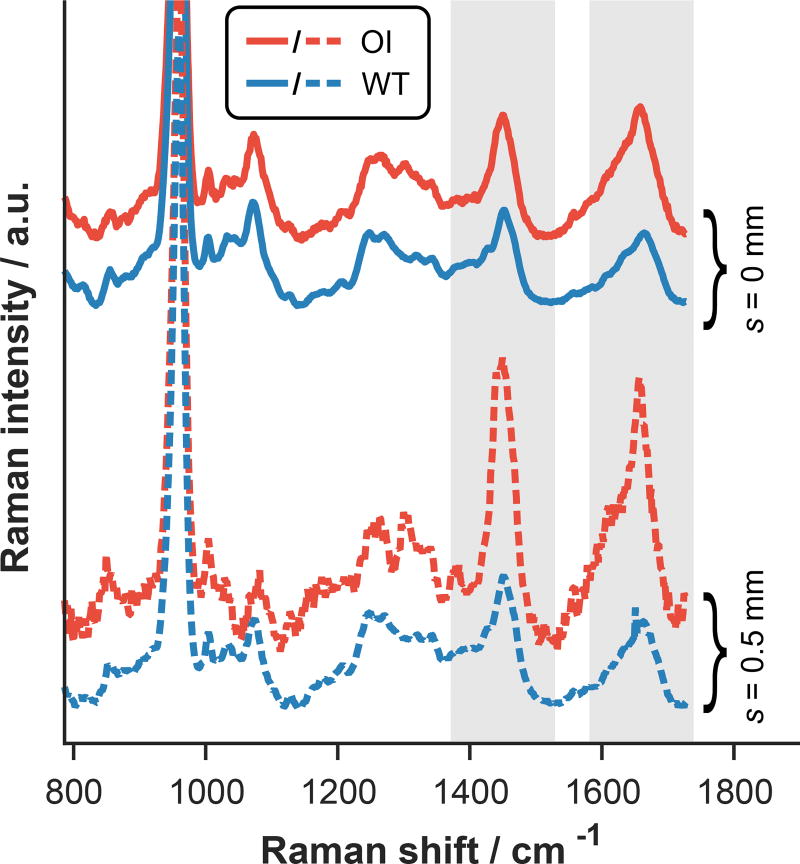
Figure 4.
Representative SORS data acquired from the epiphyses of WT and OI tibiae at different spatial offsets and all normalized to the height of the phosphate peak near 960 cm−1. Spectroscopic differences between the WT and OI data are more apparent at deeper sampling depths (probed with s = 0.5 mm) as highlighted by the gray columns.

