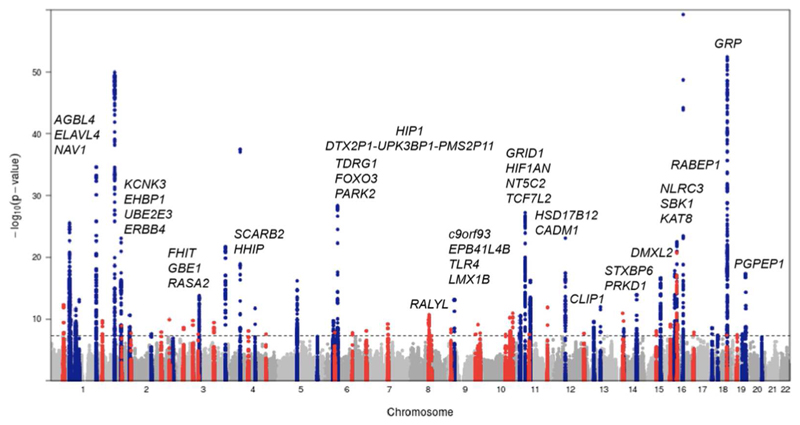
Figure 1. Manhattan plot showing body mass index (BMI)-associated variants with loci identified prior to 2015 in blue and novel loci identified by Locke et al. (33) in red.
Novel loci are labelled with the nearest gene, and the y-axis is truncated to allow easier observation of novel associations. This plot is reproduced from Locke et al. (33) with the permission of the authors.

