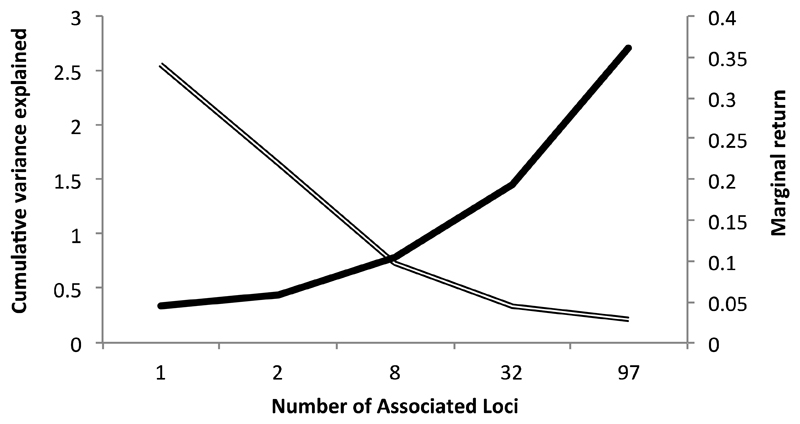
Figure 2. The interplay between increased variance explained and diminishing marginal return as the number of confirmed body mass index (BMI)-associated genetic loci has increased.
The single line represents the cumulative variance explained and the double line the marginal return, calculated as the cumulative variance explained divided by the number of loci (29, 33, 100, 101, 102).

