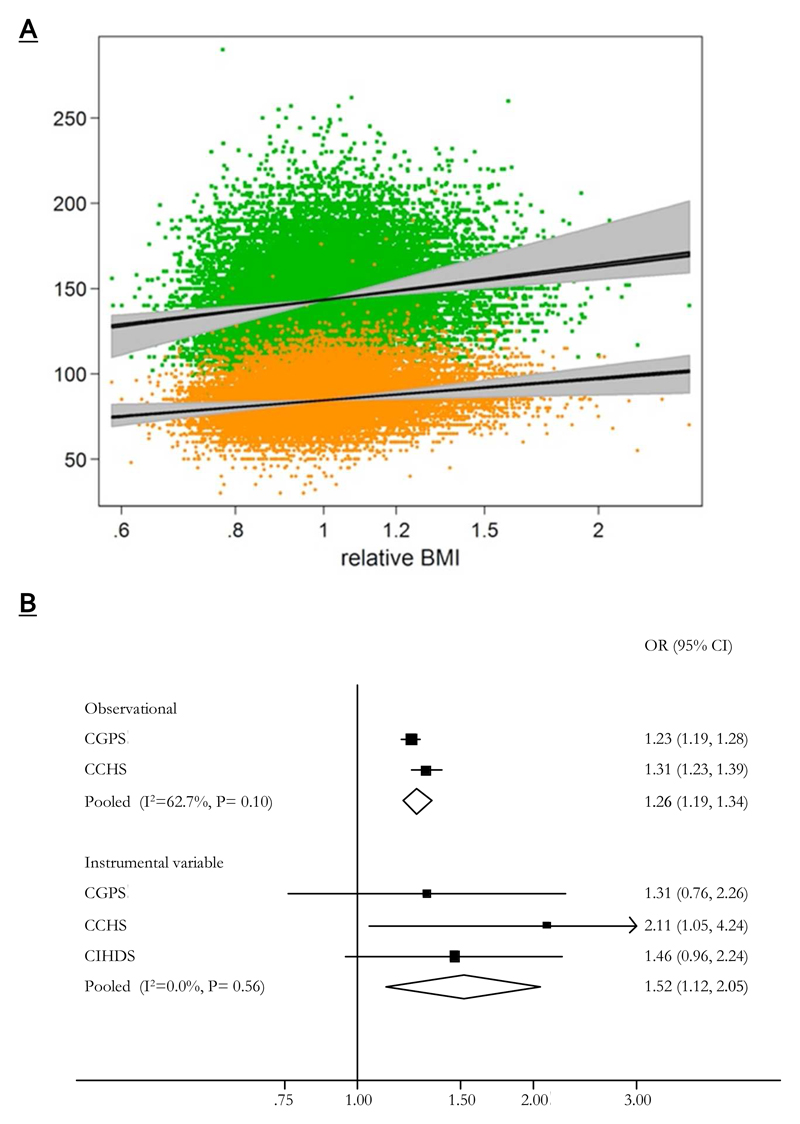
Figure 4. The comparison of observational and Mendelian randomisation derived estimates for blood pressure and ischaemic heart disease.
(A) Linear relationships between body mass index and blood pressure derived from observational and Mendelian randomization analyses. Upper scatter indicates systolic blood pressure and the lower diastolic. Grey areas around the estimated relationships indicate 95%CI for Mendelian randomisation estimates and in black those for observational estimates (plot generated from analysis for (43)). Note that for this analysis the log of body mass index was regressed on sex, age, age squared, log(height), and an age-sex interaction and exponentiated to give an individual’s “relative BMI,” that is, the ratio between his or her actual BMI and that expected for his or her sex, age, and height.
(B) Meta-analysis forest plots of observational and instrumental variable estimates of the relationship between ischaemic heart disease and body mass index. Odds ratios are for a 4kg/m2 increase in body mass index (plot generated from analysis for (46)).

