Figure 1.

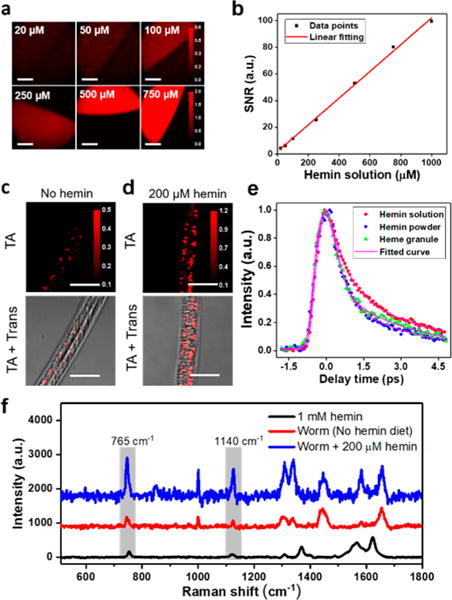
Transient absorption microscopy for in vivo imaging of heme in C. elegans. (a) TA imaging of 20, 50, 100, 250, 500, and 750 μM hemin solution (in 0.3N NH4Cl, pH 8.0). Scale bar: 70 μm. (b) TA signal-to-noise ratio plotted against concentration of hemin solution. Data were fitted linearly. (c and d) WT worms were cultured on NGM plates and synchronized to L1, which were maintained in mCeHR2 medium or mCeHR2 medium supplemented with 200 μM hemin for 16 h and then imaged using TA microscopy. Trans: transmission images. Scale bar: 20 μm. (e) Decay curves of heme granule, 1 mM hemin solution and hemin powder; about 200 pixels were selected and averaged. (f) Spontaneous Raman spectra of heme granules from worms kept on NGM plate and NGM plate supplemented with 200 μM hemin. Hemin solution (1 mM) served as reference. Pixel dwell time: 10 μs.
