Figure 6.

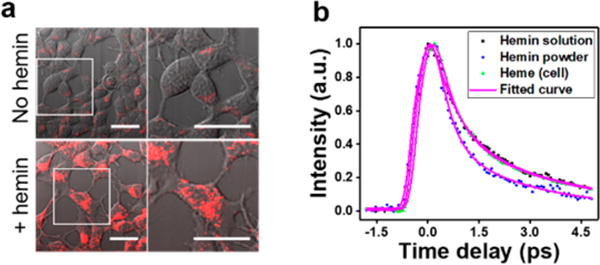
TA imaging of endogenous heme in live mammalian cells. (a) HEK293A cells were kept in DMEM medium or DMEM medium supplemented with 100 μM hemin for 2 days and subject to TA (red) and transmission (gray) imaging. Overlay of TA and transmission images are shown. Right panel: magnification view of the area in white box. Scale bar: 20 μm. (b) Time-resolved curves of hemin solution, hemin powder, and heme cluster from HEK293A cells treated with 100 μM hemin; about 200 pixels were selected and averaged. Pixel dwell time: 100 μs.
