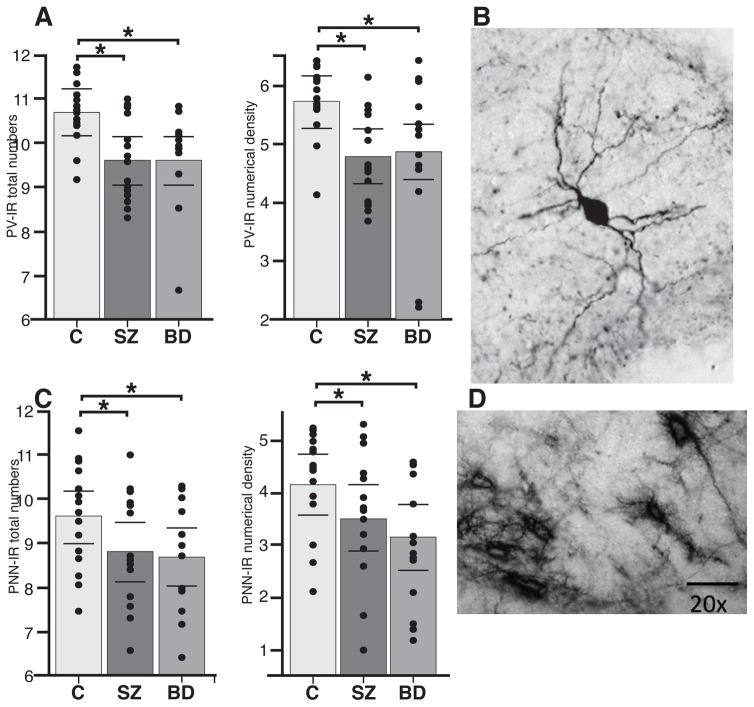
Figure 1.
PV neurons and WFA/PNNs are decreased in the TRN of subjects with SZ and BD. (a) Total number and Nd of PV neurons in the TRN of healthy subjects, SZ and BD subjects. Marked decreases were observed in each disorder with respect to healthy controls. SZ: PV neurons - Tn: p < 0.0001, Hedges’ g = −2.08, 71.1% decrease; Nd: p < 0.0001, Hedges’ g= −2.09, 66.4% decrease; BD: PV neurons - Tn: p < 0.0007, Hedges’ g = −1.88, 72.1% decrease; Nd: p < 0.003, Hedges’ g= −1.55, 55.9% decrease. (b) Example of a PV neuron in the TRN of a healthy human subject. (c) Total number and Nd of WFA/PNNs in the TRN of healthy subjects, SZ and BD subjects. Significant decreases were observed in each disorder with respect to healthy controls. SZ: WFA/PNNs - Tn: p < 0.006, Hedges’ g = −1.40, 81.3% decrease; Nd: p < 0.003, Hedges’ g= −1.52, 67.2% decrease; BD: (WFA/PNNs - Tn: p < 0.04, Hedges’ g = −0.77, 57.1% decrease; Nd: p < 0.001, Hedges’ g= −0.92, 51.9% decrease). (d) Example of WFA/PNNs in the healthy human TRN. Note that all bar graphs show logarithmically transformed values and do not reflect the effects of confounding variables included in ANCOVA models.

