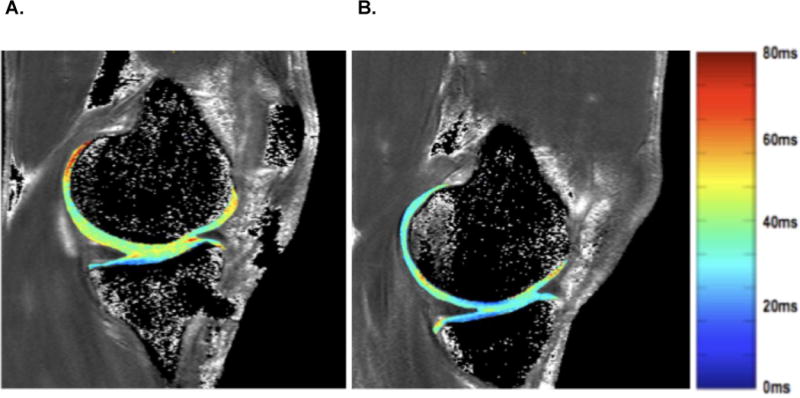
Figure 2.

Represents a sample map of T1ρ relaxation times of an anterior cruciate ligament reconstructed (ACLR) knee (1A) and contralateral knee (1B). Figure 1A depicts the articular cartilage from an ACLR knee with greater T1ρ relaxation times compared to the contralateral uninjured knee (1B). The color of the cartilage corresponds with a specific T1ρ relaxation time value (ms) that is outlined in the color scale.
