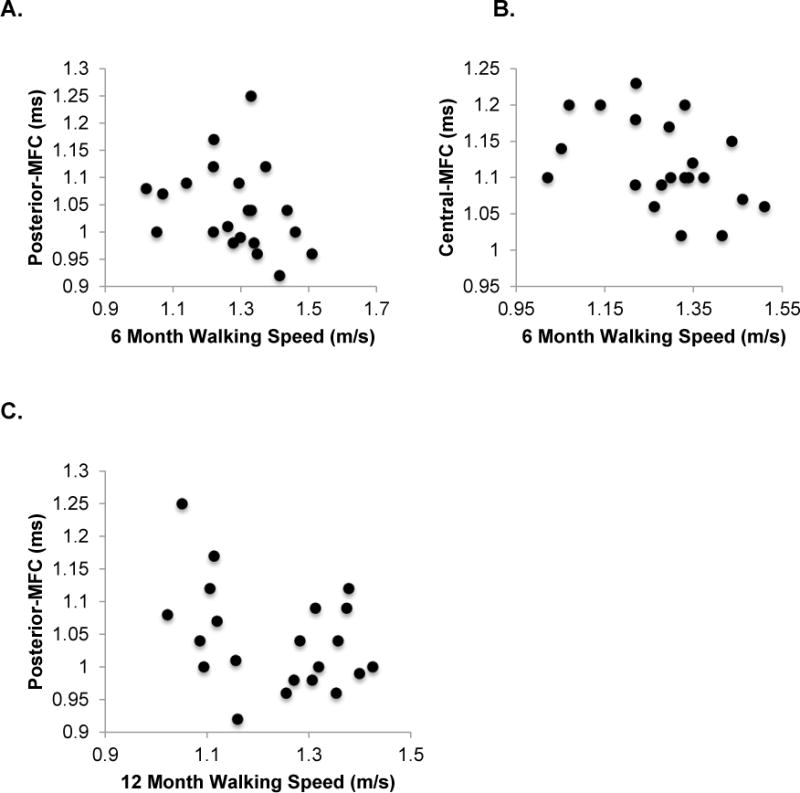
Figure 3.

Scatter-plots depicting significant associations between 6 (2A & 2B) and 12 (2C) month walking speed (x-axis) and 12 month inter-limb T1ρ relaxation time ratios (y-axis). Slower walking speed at 6 months following ACLR significantly associated with higher 12 month inter-limb mean T1ρ relaxation time ratios of regions of interest in the articular cartilage of the posterior medial femoral condyle (MFC; r=−0.448, P=0.027; 2A) and central MFC (r=−0.448, P=0.042; 2B). Those who walked slower at 12 months following ACLR significantly associated with 12 month inter-limb mean T1ρ relaxation time ratio for posterior MFC (r=−0.471, P=0.036, 2C).
