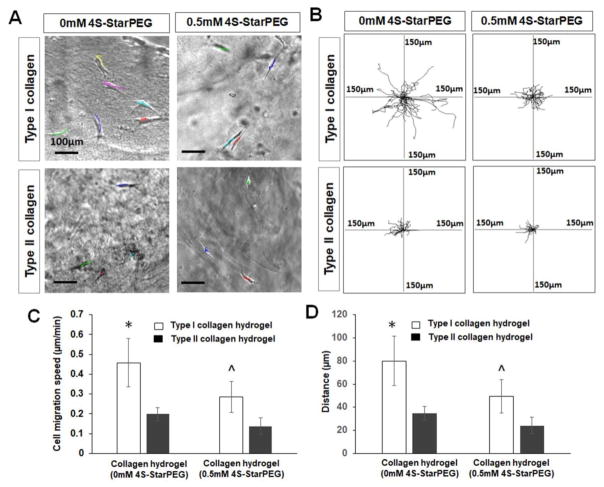
Figure 7.
Migration of DPSC-derived chondrogenic cells in hydrogels. (A) Cells migrated in collagen hydrogels (each line indicates one migration track of a cell). Scale bar: 100 μm. (B) Cell migration paths determined by video monitor tracings (position of all cells at t = 0 minute represented by origin position (center of frame), with migratory track of each cell at 3 hours plotted as single line on graph; each axis arm represents 150 μm of translocation distance). (C) Quantification of cell migration speed in hydrogels. (D) Quantification of cell migration distance in hydrogels. *, p < 0.05, compared with cell migration in type II collagen hydrogel and crosslinked type I and type II collagen hydrogels. ^, p < 0.05, compared with cell migration crosslinked type II collagen hydrogel.

