
Fig 5. HCN1 and HCN2 isoforms were predominately expressed in the rat GG.
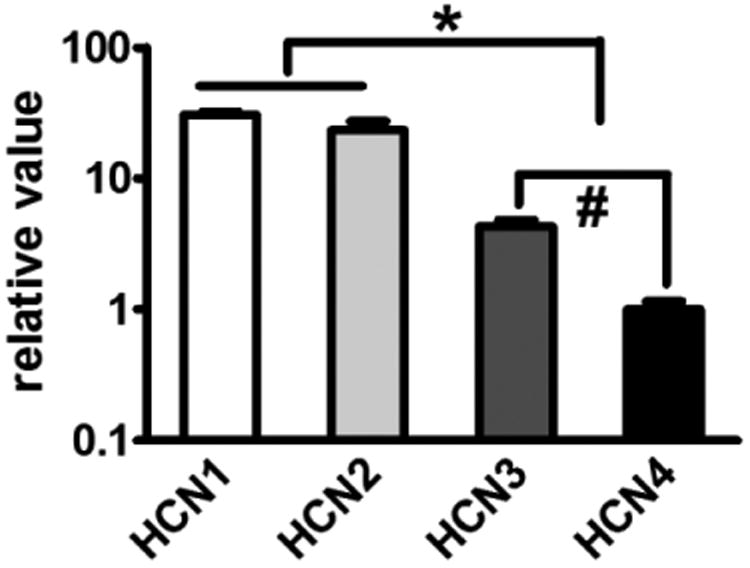
qRT-PCR analysis of HCN1-4 mRNA levels in the rat GG. HCN1-2 vs. HCN3-4, * p<0.05, n=5; HCN3 vs. HCN4, #p<0.05, n=5.
Official websites use .gov
A
.gov website belongs to an official
government organization in the United States.
Secure .gov websites use HTTPS
A lock (
) or https:// means you've safely
connected to the .gov website. Share sensitive
information only on official, secure websites.
qRT-PCR analysis of HCN1-4 mRNA levels in the rat GG. HCN1-2 vs. HCN3-4, * p<0.05, n=5; HCN3 vs. HCN4, #p<0.05, n=5.