
Figure 3.
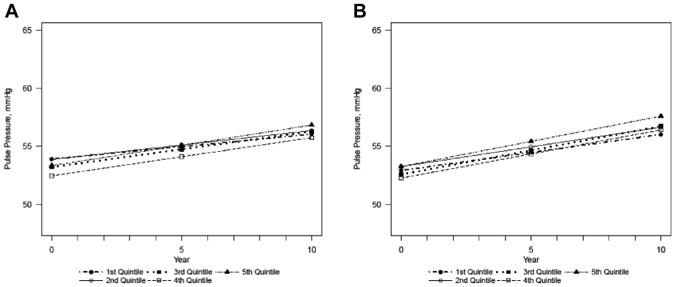
Estimated pulse pressure over time by quintiles of creatinine-adjusted urinary cadmium, in the (A) minimally adjusted and (B) fully adjusted models. Minimally adjusted for sex, age, age2, center. P-value for change over time: .848. Fully adjusted for sex, age, age2, center, estimated glomerular filtration rate, body mass index, smoking status, education duration, history of diabetes, triglyceride level, total cholesterol level, high-density lipoprotein cholesterol level, alcohol consumption and physical activity. P-value for change over time: .858.