
Figure 1.
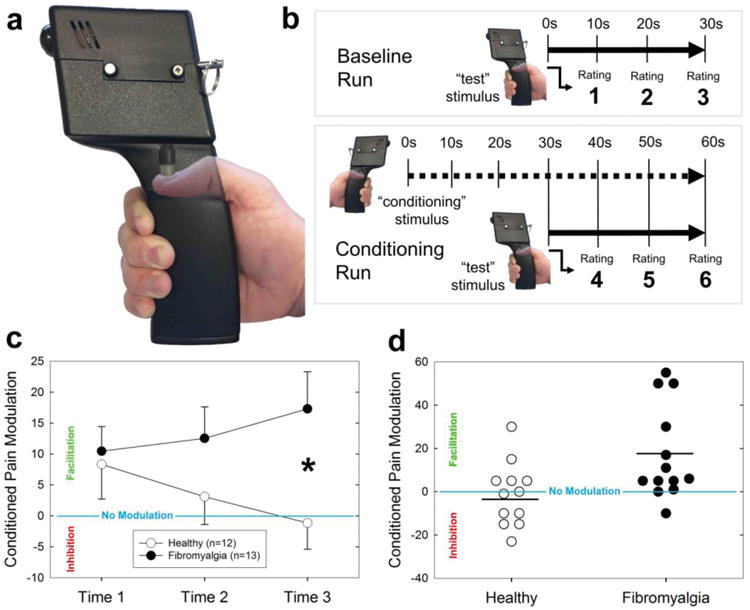
Behavioral measurement of conditioned pain modulation (CPM). a) The device used to measure pressure pain sensitivity and CPM. The piston pressed down onto the middle of the thumbnail at a pressure intended to produce a pain intensity rating of 40-50 out of 100. b) First, subjects underwent a baseline run with the test stimulus alone, followed by a conditioning run where the test stimulus was presented concurrently with a noxious pressure applied to the contralateral thumb. The thick solid line indicates time when the test stimulus was applied and the thick dotted line indicates when the conditioning stimulus was applied. Subjects rated the painfulness of the test stimulus 3 times per run. c) The three time points represent the painfulness of the test stimulus in the conditioning run subtracted from its painfulness at the corresponding time in the baseline run (e.g. Time 1 = Rating 4 – Rating 1); thus, negative numbers indicate inhibition of the test pain and positive numbers indicate test pain facilitation. Error bars represent +/- 1 SEM. *p<.05. d) Individual pain modulation scores at Time 3, separated by group. Horizontal black lines represent group means.