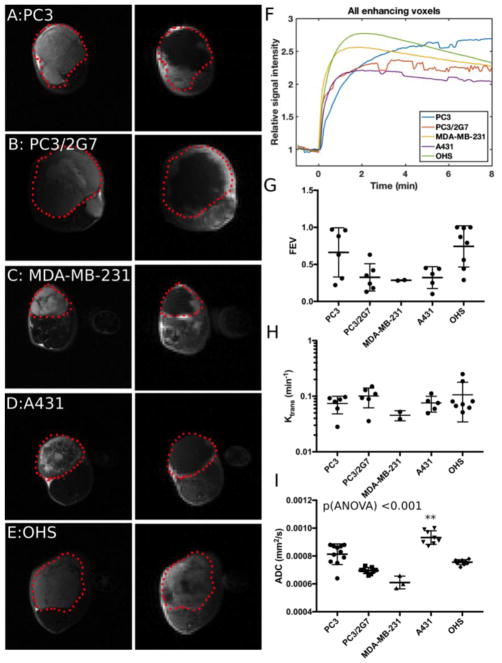
Fig. 5.
MRI data from the 5 tumor models. A–E: T2 weighted images (left) of the tumor outlined in red and T1-weighted image (right) 1 minute after injection of gadolinium contrast agent. Signal enhancement due to presence of the contrast agent can be seen mainly in the periphery of the carcinomas (A–D) and in most of the OHS sarcoma model (E). F: Mean signal enhancement curves for one tumor from each model. G: Fraction of voxels in the tumor that show more than 1.5 RSI after 1 minute. H: Median Ktrans of the enhancing tumor voxels. I: Median ADC values calculated from diffusion weighted MRI for 1mm thick tumor rim ROI. ** Indicates tumor groups significantly different from the others.

