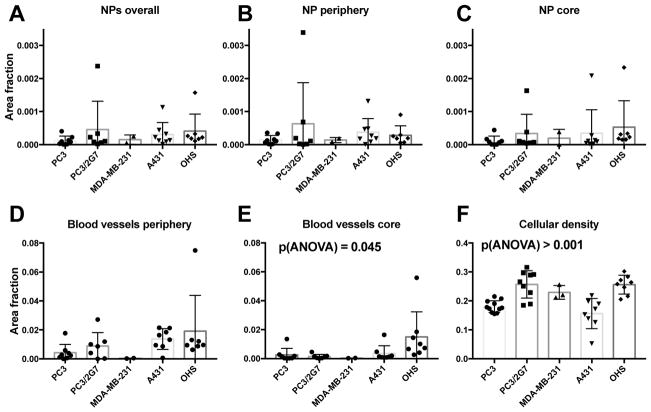
Fig. 7.
Fluorescence image analysis of the 5 tumor models determining: A–C: amount of nanoparticle in the whole tumor, tumor periphery (outer 1mm) and tumor core. D: Area fraction of nuclei, E and F; blood vessel area fraction in the tumor periphery and core. Each datapoint represent one tumor and mean and standard deviation is shown.

