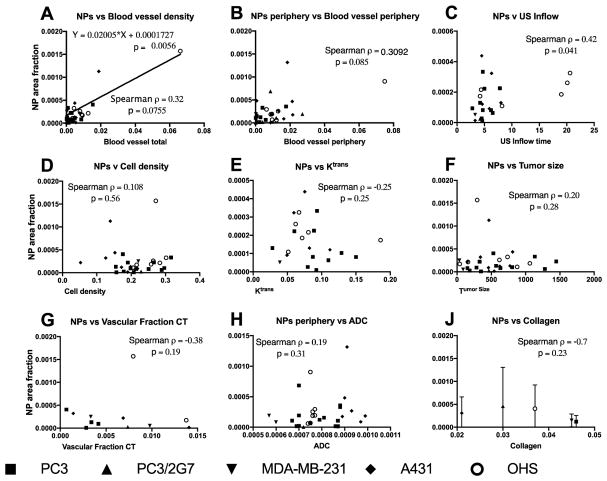
Fig. 9.
Plots of NP accumulation vs different parameters. Each datapoint represent one tumor except for J which shows mean and standard deviation from 6 sections in 2 tumors from each type. Spearman rank correlations are shown and was significant for NP vs Inflow time. A linear relation was found between NPs and blood vessel density.

