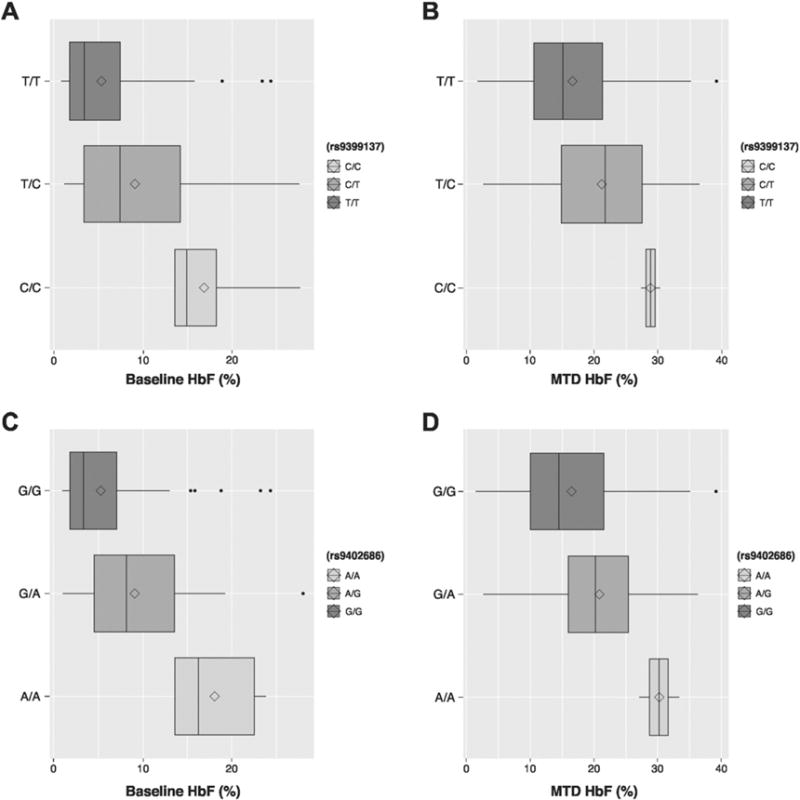
Fig. 2.

Effect of HMIP-2 SNPs on HbF at baseline and hydroxyurea MTD. A) Effect of rs9399137 on baseline HbF. B) Effect of rs9402686 on baseline HbF. C. Effect of rs9399137 on HbF at MTD. D. Effect of rs9402686 on HbF at MTD. Each plot shows the untransformed HbF levels of the three genotypes. The line represents the median and the diamond the mean of the HbF (%). *P < 0.05; **P < 0.01; ***P < 0.001.
