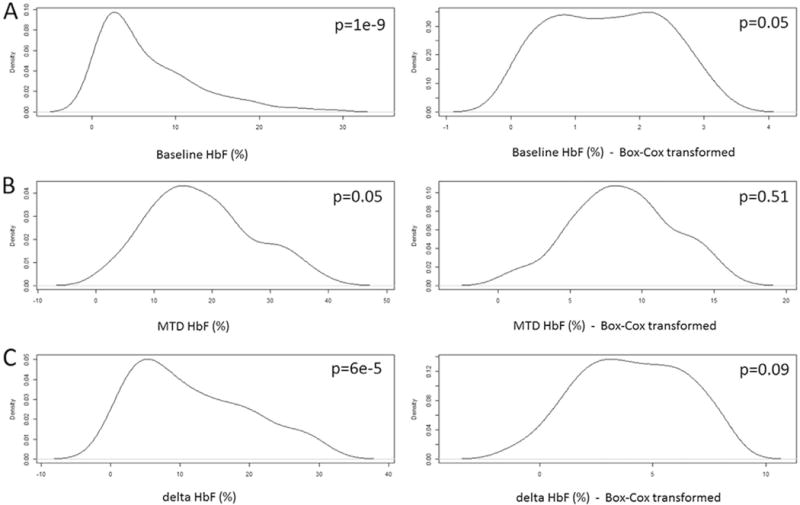
Fig. 3.

Distribution of fetal hemoglobin (HbF). Data is shown untransformed and transformed using Box-Cox method. A) Distribution of HbF at baseline. B) Distribution of HbF at maximum tolerated dose (MTD). C) Distribution of delta HbF (HbF at MTD – HbF at baseline). P: P-value of the Shapiro-Wilk test.
