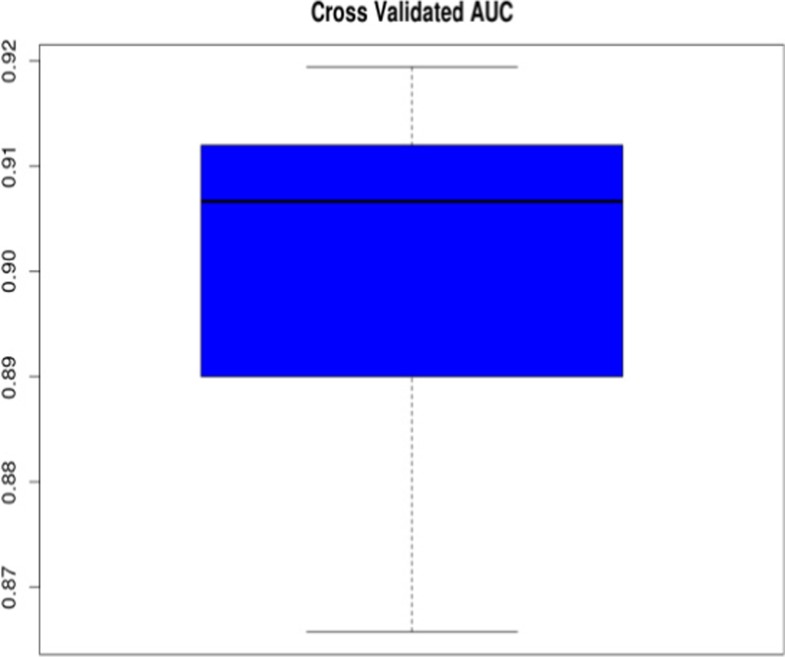
Fig. 4.
Prediction of correct patient cluster assignment: The boxplot shows the distribution of 10 AUC values resulting from 10 repeats of a tenfold cross-validation procedure. Within each cross-validation loop, a GBM classifier was trained on 9/10 of the available patient data and tested on the hold out rest. A 50% AUC indicates chance level and a AUC of 100% a perfect prediction performance

