
Fig. 6.
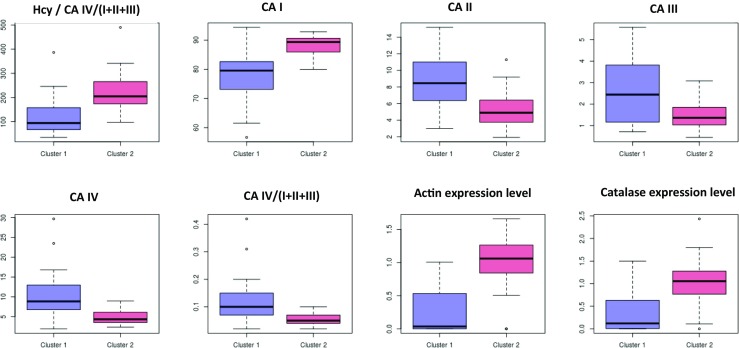
Boxplots depicting the distribution of individual variables in low risk (cluster 1) and high risk (cluster 2) patient subgroups. All markers show a statistically significant difference between high- and low-risk groups after multiple testing corrections