Fig. 4.
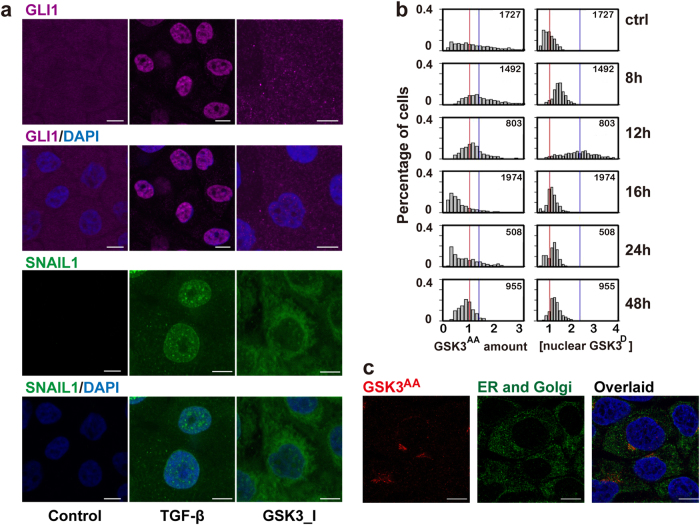
TGF-β induced temporal switch between active and inhibitive phosphorylation forms of GSK3 proteins. a IF images showed that inhibiting GSK3 enzymatic activity alone increased SNAIL1 accumulation but did not recapitulate TGF-β induced GLI1 nuclear translocation. b Quantification of the IF images of MCF10A cells at different time points after TGF-β treatment. Red vertical lines indicate the mean value of the distributions at time 0, and blue vertical lines represent that at 8 h (for GSK3AA) or at 12 h (for GSK3D), respectively. c IF images showing GSK3AA localization at the endoplasmic reticulum center (ERC)

