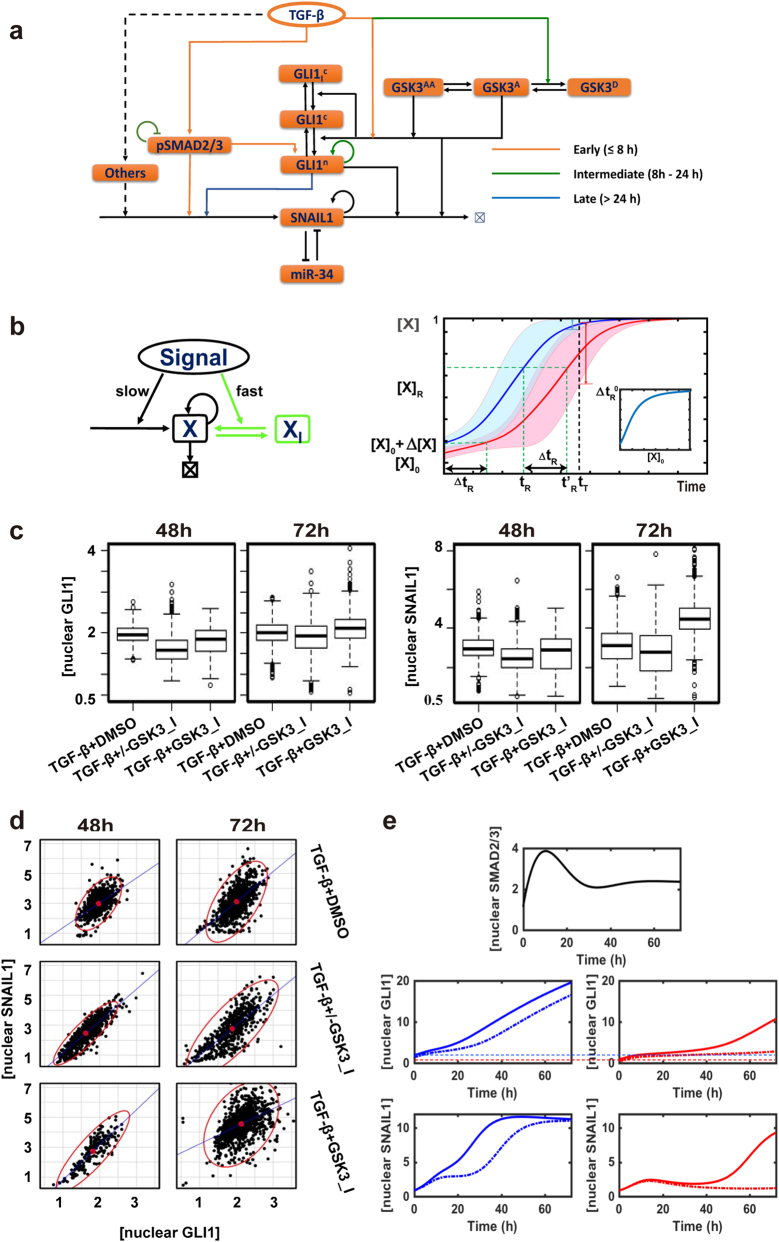
Fig. 5.
The GSK3 phosphorylation switch smoothens the SMAD-GLI1 relay. a Proposed expanded network for TGF-β induced SNAIL1 expression. b Left: Schematic of a generic positive feedback loop network. Also shown in green is an additional reservoir of the molecules in inactive form (XI) that can convert quickly into the active form (X) upon stimulation. Right: The response time tR is sensitive to the initial concentration, (X)0 vs. (X)0 + Δ(X)0. The inlet figure shows the dependence of ΔtR on (X)0 with Δ(X)0 fixed. c Box plots of GSK3 inhibition experimental data. d Scattered plots of GSK3 inhibition experimental data. Red points are the center of the scattered plots and each ellipse encloses 97.5% of the data points. Both were drawn with the R package, car::data.ellipse. e Computational simulation of SMAD, SNAIL1 and GLI1 behavior with (solid line) or without (dotted line) initial boosting in cells with high basal GLI1 level (left panels) or low basal GLI1 (right panels)

