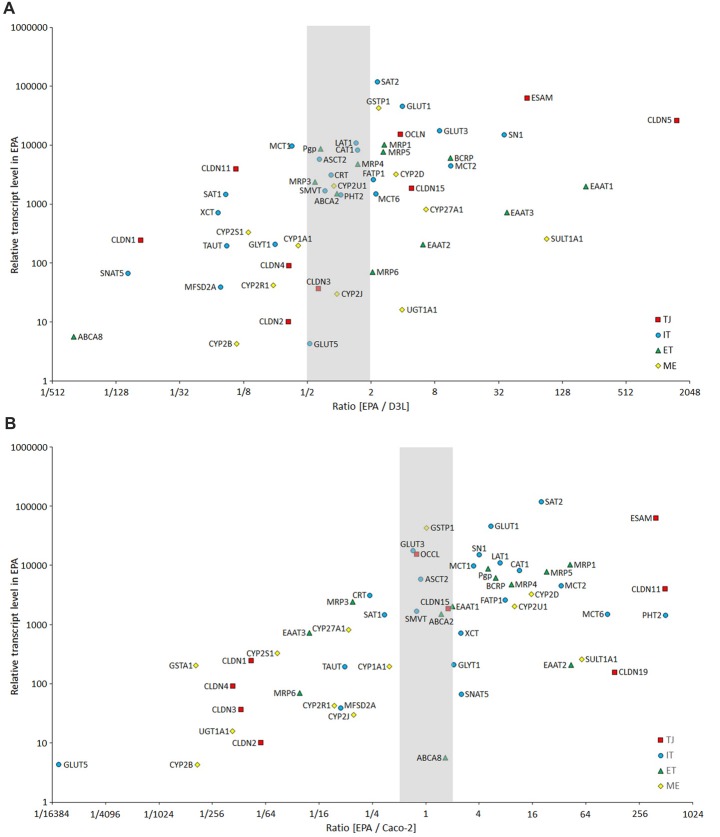
Figure 12.
Comparison of the expression of selected BBB genes between the primary rat brain endothelial cell-based EPA model and the human brain endothelial cell line D3 (A), and the human intestinal cell line Caco-2 (B) measured by inventoried TaqMan Gene Expression Assays. The figure shows the ratio between the gene expression level of tight junction proteins (TJ, red square), influx transporters (IT, blue dot), efflux transporters (ET, green triangle) and selected metabolic enzymes (ME, yellow diamond) in EPA and D3 or Caco-2 cells. The graph also displays the expression values in the EPA sample on the y-axis to demonstrate the level of expression of studied genes.

