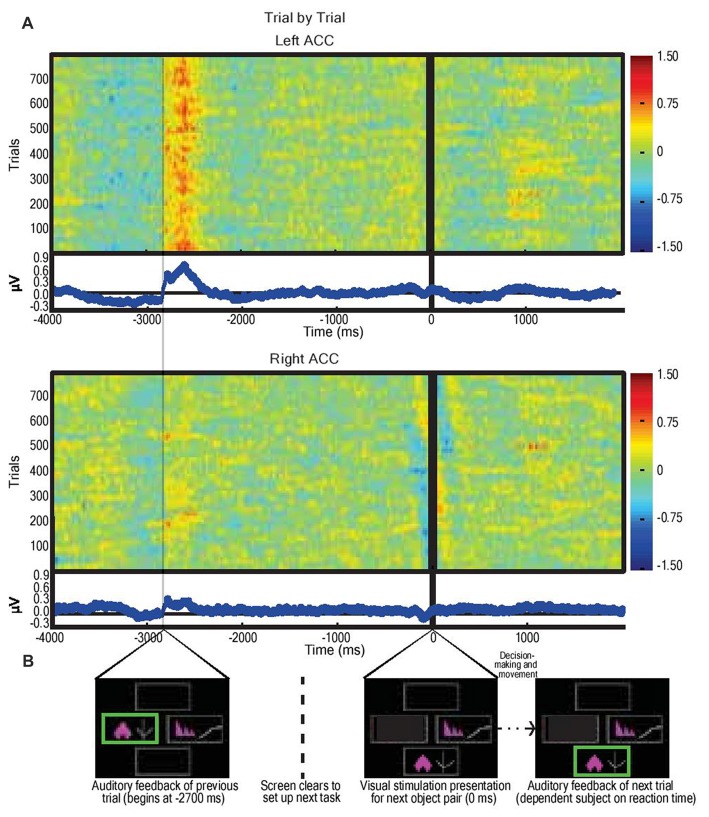
Figure 3.
Average dorsal anterior cingulate cortex (dACC) bipolar mode field potential response in three subjects performing IED task, trial by trial responses. (A) Trial-by-trial field potential responses (y axis, n = 796 trials, three subjects) from left and right dACC (regardless of correct or incorrect result) vs. time representing the decision-making period composed of: selection of object (−4000 ms to −2700 ms); receipt of feedback (−2700 ms to −2100 ms); clearing of the screen (−1500 ms to −200 ms); and object pair presentation of the subsequent trial (0 ms onwards). Color represents magnitude of the field potential (red = higher voltage) such that individual pixels represent the magnitude of the local field potential (LFP) at a point in time in a trial. The trials were locked to stimulus presentation (0 ms). The time delay between start of feedback of the preceding trial and presentation of visual object pair in the next trial was constant (2700 ms). Responses were normalized (x-mean standard deviation) but not filtered. Blue line graphs represent average of individual trial responses with Y-axis representing normalized voltage and X-axis representing time. The most notable result is the evidence of a left dACC event related potentials (ERP) response to feedback at approximately −2700 ms with a magnitude of 0.8 μV. A lesser but still significant (P < 0.05) response also appeared in right dACC at this time with a magnitude of 0.3 μV. There was no apparent response to visual object presentation (0 ms) nor to movement (prior to −2700 ms). (B) Sample IED images aligned with events from Figure 2B.

