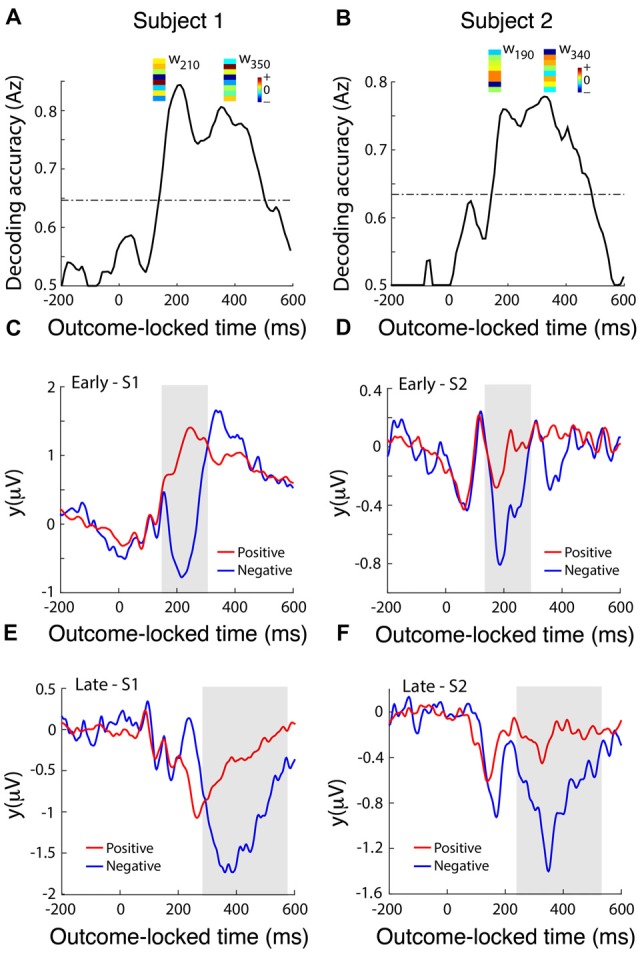
Figure 4.

dACC discriminates positive vs. negative feedback. (A,B) Decoding performance (Az) during outcome valence (positive-vs-negative outcome) discrimination of feedback-locked monopolar LFP data for subject 1 (A) and subject 2 (B). Subject 3 did not produce enough incorrect trials to reliably train the multivariate discriminant. The dashed line represents the subject-specific Az value leading to a significance level of P = 0.01, estimated using a bootstrap test. Spatial weights (w) of subject-specific discriminating (early and late) components are shown over the relevant peak component times. These weights represent the relative contribution of each LFP electrode to the overall discrimination performance (the sign of the weights is arbitrary and depends on the polarity of the corresponding electrode signals). Reproduced with permission from Figure 1 of Gillies et al. (2017), under theopen access Creative Commons Attribution 4.0 International License (http://creativecommons.org/licenses/by/4.0/). (C,D) Temporal profile of the early discriminating component activity (y(early)) averaged over trials (for subject 1 and subject 2 shown in A and B, respectively) for each of the positive (red lines) and negative (blue lines) outcomes, obtained by applying the subject-specific spatial weights estimated at the time of maximum discrimination (see timing of w’s shown in A,B) over an extended time window spanning the delivery of feedback (−200 ms to 600 ms post-feedback). The gray shaded area is used to highlight the range over which the difference between the two outcome types is more prominent. (E,F) The temporal profile of the late discriminating component activity (y(late)) for each of the positive and negative outcomes. Same convention as in (C,D).
