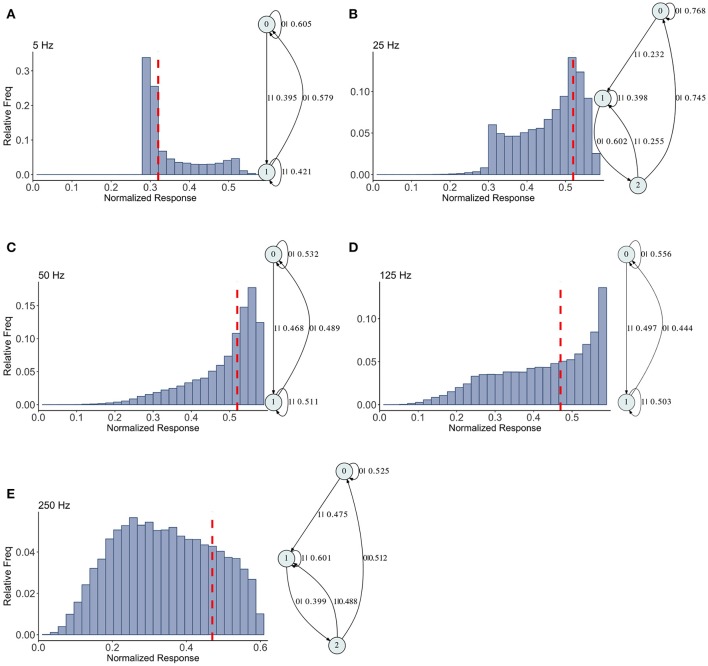
Figure 6.
Causal state machines (CSMs) reconstructed and their corresponding relative frequency distributions obtained from mixed FD model driven by a Poisson spike train with mean rates (A) 5, (B) 25, (C) 50, (D) 125, and (E) 250 Hz. In (A,C,D), CSMs for mean firing rates of 5, 50, and 125 Hz consist of two states with similar structure, emitting successive large responses followed by small responses. 3-State CSM for mean firing rate 25 Hz has more complex graph structure. Note that this is inflection point for this synapse model (see Figure 1).

