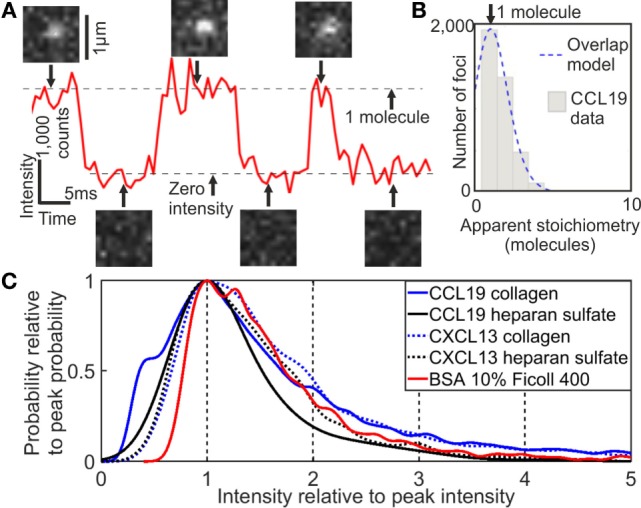
Figure 2.

Single-molecule stoichiometry of CCL19-AF647. (A) Tracking of photoblinking Alexa Fluor 647 (AF647): localizations and intensity over time with sample images from the acquisition. (B) Distribution of apparent CCL19 foci stoichiometry (gray) overlaid with the predicted distribution based on randomly overlapping point spread functions (blue). (C) Kernel density estimates of intensity of AF647 labeled CCL19 in collagen (solid blue line), and under heparan sulfate immobilization (solid black line); CXCL13 in collagen (dotted blue line), and under heparan sulfate immobilization (dotted black line); and bovine serum albumin in 10% Ficoll (solid red line). All traces are normalized to the primary peak for clarity (see Supplementary Material).
