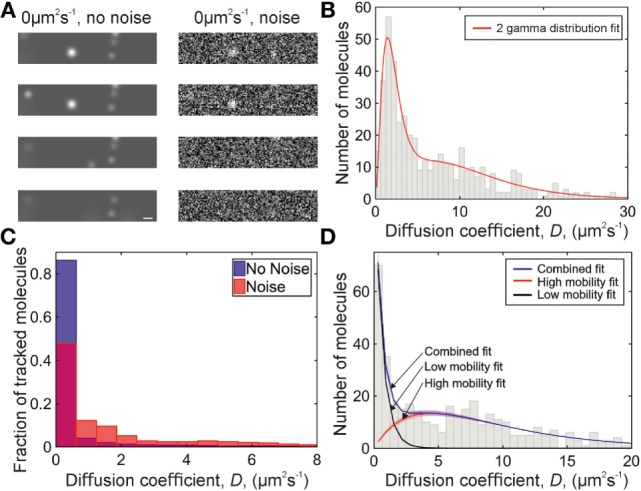
Figure 3.

Simulations of chemokine data. (A) Sample simulation images, shown with and without Gaussian white noise added. Scale bar 1 µm. (B) Two-gamma distribution fit (red) to diffusion coefficients found from a simulation of 1.6 and 10 µm2s−1 data with Gaussian white noise. (C) Histograms showing the distribution of simulated 0 µm2s−1 data with (red, overlaid) and without (blue) Gaussian white noise. (D) Diffusion coefficient distribution from a simulation of 0 and 9 µm2s−1 data with Gaussian white noise. Fitted populations are shown in black for the immobile, red for the mobile, and blue for the combined fit. Shaded areas indicate one SD.
