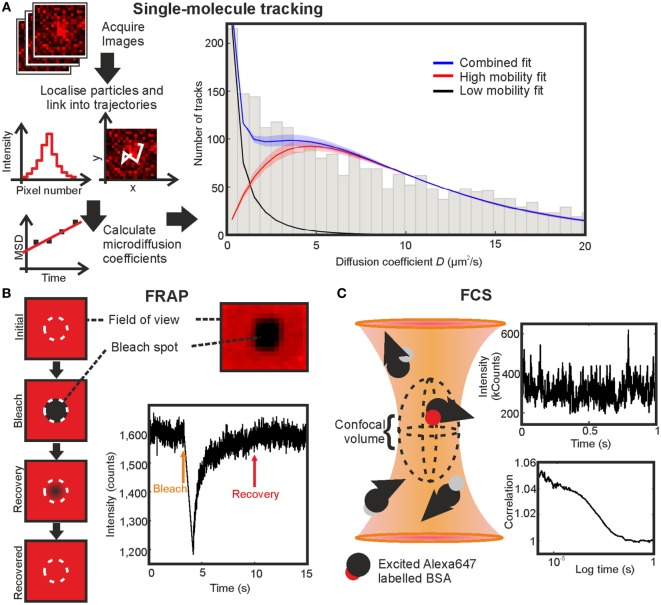
Figure 4.
Comparing fluorescence recovery after photobleaching (FRAP), fluorescence correlation spectroscopy (FCS), and single-molecule tracking on BSA-AF647 in 10% Ficoll 400. (A) Single-molecule tracking: simplified schematic of the stages in tracking and the resulting fit with shaded regions indicating error bounds of one SD. (B) FRAP: schematic of technique, profile of bleached region in an immobilized sample, and example fluorescence intensity recovery trace. (C) FCS: schematic of the confocal volume, example section of intensity fluctuation trace, and correlation curve.

