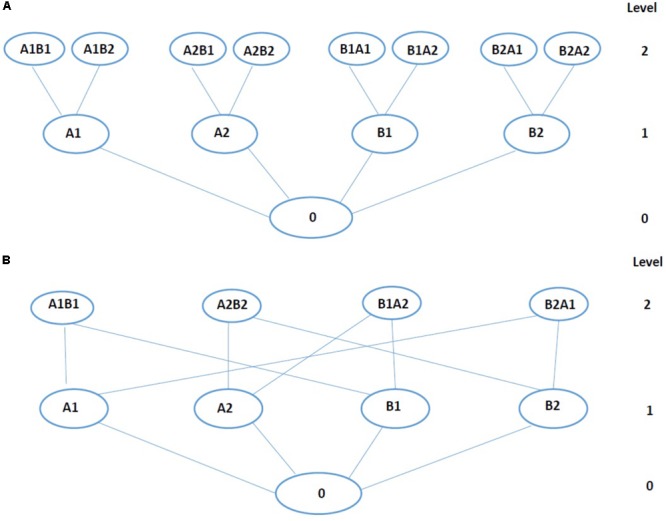
FIGURE 2.

Tree representation of the data. (A) The tree with sequential structure. (B) The tree with trellis-like structure (alternative version of the A). Each circle stands for single drug-dose or combination. Letter and number indicates drug and dose, respectively. For a tree, level 0 is the control (no drug), level 1 is composed of individual drug treatment with two doses, and level 2 is composed of drug-dose combinations. The level depends on the size of the combination.
