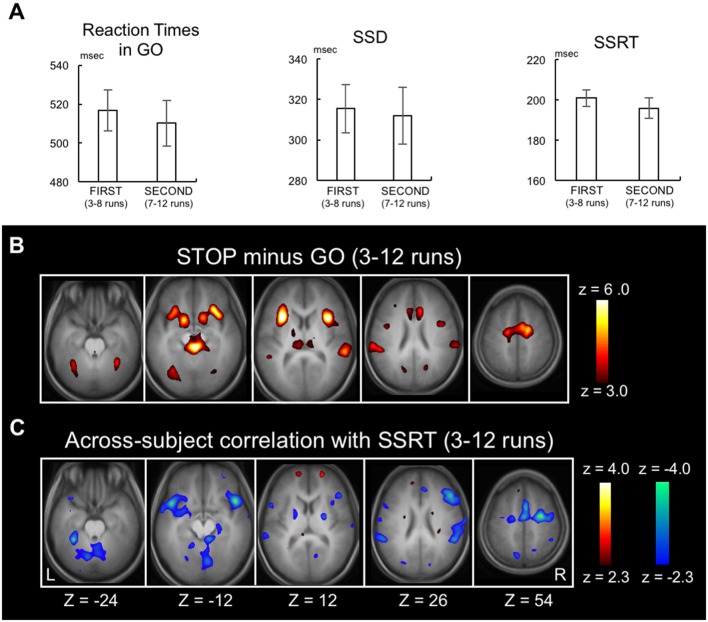
Figure 2.
Replication of previously published data. (A) Go reaction time, stop signal delay and the stop-signal reaction time (SSRT) in FIRST (3rd to 8th) and SECOND (7th to 12th) parts of the runs. Error bars indicate standard error of means. (B) Statistical maps of brain activation during response inhibition in the whole stable runs (3rd to 12th) revealed by the contrast Stop success trials vs. Go success trials. The color scale reflects statistical significance as shown by the color bar to the right (above z > 2.3 for a display purpose). Z below the statistical maps indicates the Z coordinate in MNI atlas. (C) Statistical maps of the across-subject correlation between the SSRT and the brain activity related to response inhibition in the whole stable runs (3rd to 12th).

