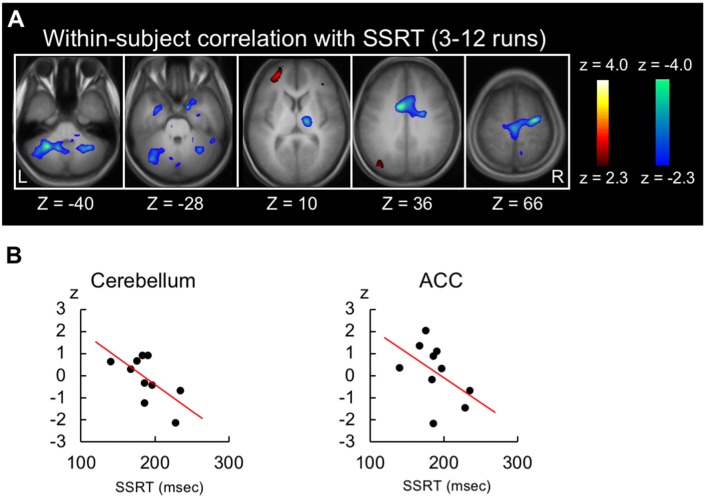
Figure 3.
Results of the within-subject correlation analysis. (A) Statistical maps of the within-subject (across-run) correlation between the SSRT and the brain activity related to response inhibition in the whole stable runs (3rd to 12th). The format is similar to that in Figure 2C. (B) Scatter plots of the within-subject correlation in the anterior cingulate and cerebellar regions for one representative subject.

