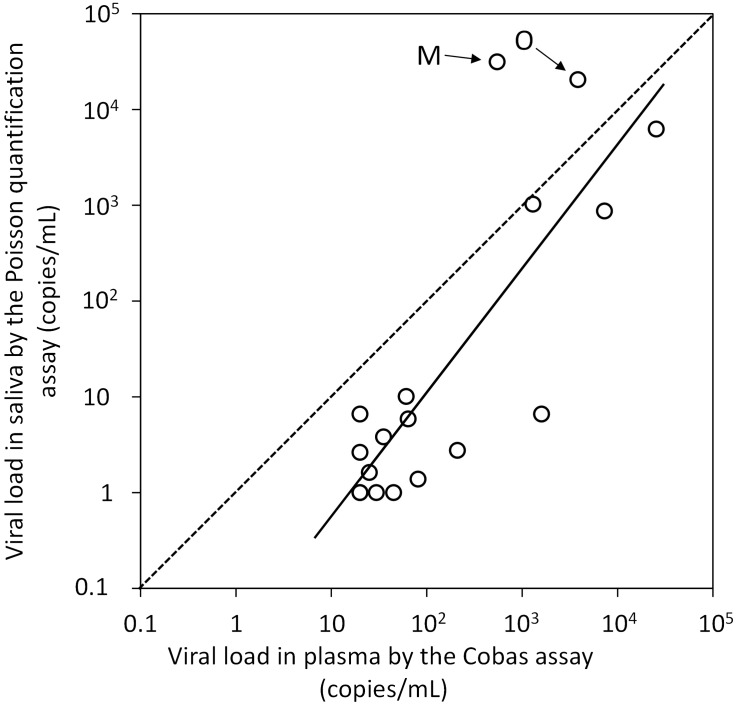
Figure 2.
Regression analysis of the relationship between plasma human immunodeficiency virus type 1 (HIV-1) viral load (determined using the COBAS® AmpliPrep/COBAS® TaqMan® HIV-1 Test, v1.0) and salivary HIV-1 viral load (determined using a Poisson quantitative polymerase chain reaction assay) in 18 patients with HIV-1. Two patients (M and O) were found to have salivary viral loads that were higher than the plasma viral loads (arrows). Data presented as the mean of all samples for each patient. The solid diagonal line represents the single regression curve for the data, with a good linear relationship between the saliva and plasma viral loads (P <0.01; r2 = 0.75). The dotted line represents equal viral loads in plasma and saliva (r2 = 1.0) for comparison

