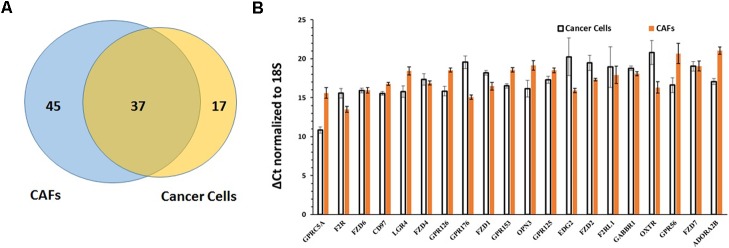
FIGURE 8.
Comparison of GPCR expression in PDAC cells and CAFs. (A) PDAC cells and CAFs share in expression of 37 GPCRs. (B) The 20 GPCRs shared in expression by PDAC cells and CAFs and with the highest expression in PDAC cells and CAFs, determined by averaging GPCR expression in the two cell types. Mean and SEM are indicated for ΔCt values (normalized to 18S rRNA). Lower Δ Ct values indicate higher expression.

