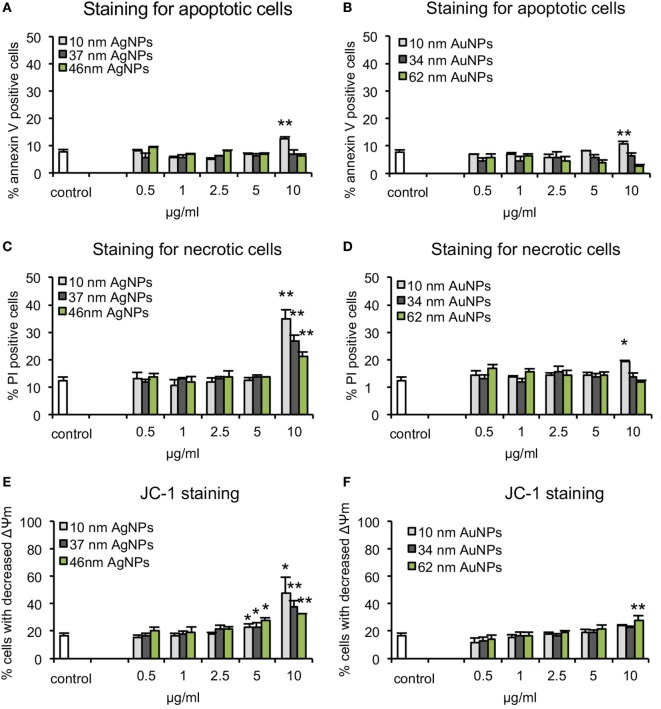
Figure 2.
Cytotoxicity assays in JAWSII cell line at 24 h of exposure to AgNPs sized 10 nm, 37 nm, and 59 nm, and AuNPs sized 10 nm, 34 nm, and 62 nm at 0.5–10 µg/ml. (A,B) Percentage of annexin V-positive (apoptotic) cells. (C,D) Percentage of PI positive (necrotic) cells. (E,F) Decrease in mitochondrial potential expressed as the percentage of cells with decreased mitochondrial potential Each bar represents the mean from five experiments (N = 5) ± S.E.M., *Significant differences with p ≤ 0.05, **p ≤ 0.01.

