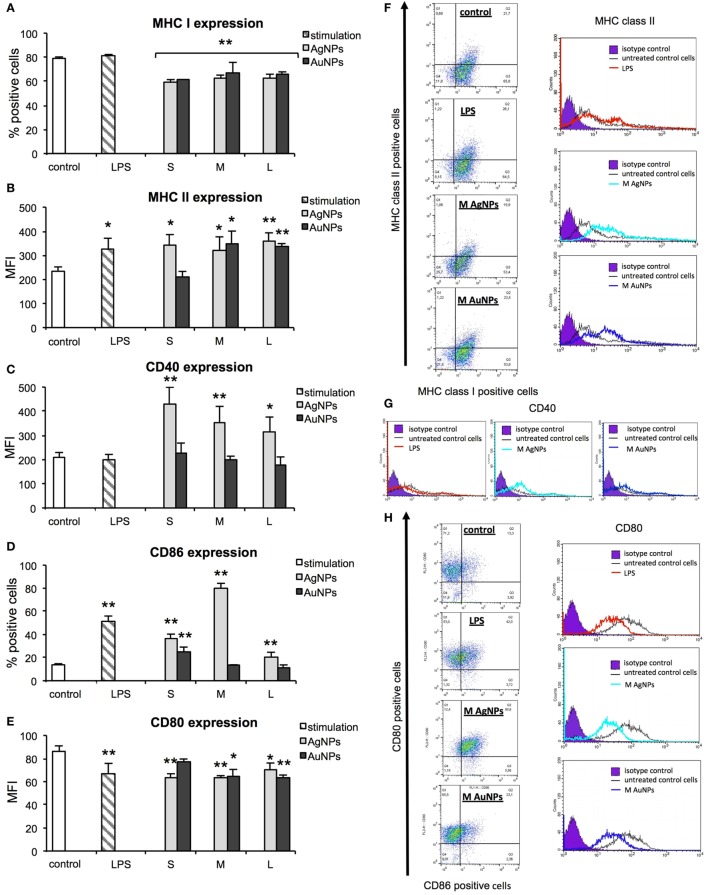
Figure 6.
Effect of nanoparticles (NPs) on expression of surface activation markers. MHC class I (A), MHC class II (B), CD40 (C), CD86 (D), and CD80 (E) from 5 experiments (N = 5) ± S.E.M. (F) Representative dot plots (left panel) for MHC I and MHC II expression and representative histograms for MHC II expression. (G) Representative histograms for CD40 expression. (H) Representative dot plots for CD80 and CD86 expression (left panel) and representative histograms for CD86 expression (right panel). *Significant differences with p ≤ 0.05, **p ≤ 0.01.

