Figure 1.
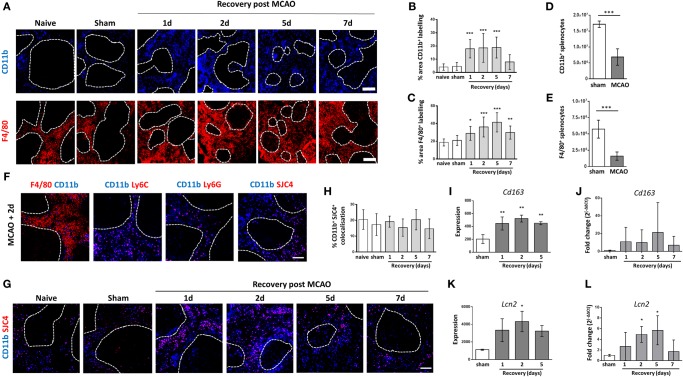
Increased density of macrophages in the red pulp (RP) after experimental stroke. (A) Immunofluorescent labeling of monocyte-derived RPM (blue, CD11b) or both tissue resident and monocyte-derived RPM (red, F4/80) in the splenic RP from naïve mice, mice recovered 1 to 7 days after middle cerebral artery occlusion (MCAO) or sham-operated mice. Quantification of immunolabelling shows increased percentage area of CD11b (B) and F4/80 (C) immunolabelling per section in mice 1–5 days or 1–7 days, respectively, after experimental stroke in comparison to sham-operated or naïve controls (naïve n = 4, sham n = 4, 1 day n = 4, 2 days n = 9, 5 days n = 5, 7 days n = 7). Flow cytometry analysis of the spleen shows that the absolute number of (D) CD11b+ and (E) F4/80+ cells is reduced 2 days after stroke in comparison to sham-operated animals (sham n = 4, MCAO n = 6). (F) Immunofluorescent labeling of CD11b (blue) alongside markers for macrophages (red, F4/80), monocytes (red, Ly6C), and neutrophils (red Ly6G; SJC4) in spleens from mice recovered 2 days after MCAO (n = 4). (G) Immunofluorescent labeling of CD11b (blue) and SJC4 (red) in the splenic RP from naïve mice, mice recovered 1 to 7 days after MCAO or sham-operated mice. (H) Quantification of CD11b and SJC4 shows the percentage of CD11b+ immunolabelling that co-localizes with SJC4 is not significantly altered 1–7 days after MCAO (naïve n = 4, sham n = 4, 1 day n = 4, 2 days n = 9, 5 days n = 5, 7 days n = 7). Analysis of spleen microarray data shows significantly increased transcription of Cd163 (I) at 1–5 days and Lipocalin2 (K) at 2 days after MCAO in comparison to sham-operated controls (sham n = 2, 1 day and 2 days n = 3, 5 days n = 4). (J) RT-qPCR analysis confirmed a trend for upregulation of Cd163 mRNA after experimental stroke. (L) RT-qPCR analysis of Lcn2 mRNA confirmed upregulation at 2–5 days after MCAO in comparison to sham operated animals (naïve n = 4, sham n = 4, 1 day n = 4, 2 days n = 9, 5 days n = 5, 7 days n = 7). Scale bars (A) 200 µm, (F,G) 100 µm. Data show mean ± SD (B,C,H–L) *P < 0.05; **P < 0.01; ***P < 0.05 one-way analysis of variance with Bonferonni correction; (D,E) unpaired t-test.

