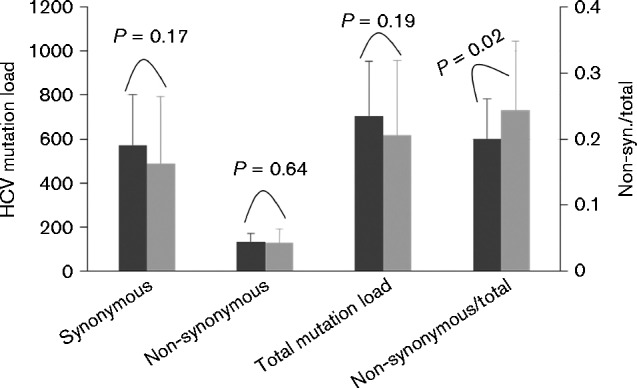
Fig. 2.

Comparison of the HCV mutation load between patients with IB28B genotype CC (n = 29, dark grey bars) and genotype CT or TT (n = 47, light grey bars). There was no statistical difference with regard to synonymous, non-synonymous or total HCV mutation load (left y-axis). However, the ratio of non-synonymous load to the total HCV mutation load was significantly higher in the genotype CC group than in the CT or TT group (P = 0.02, right y-axis).
