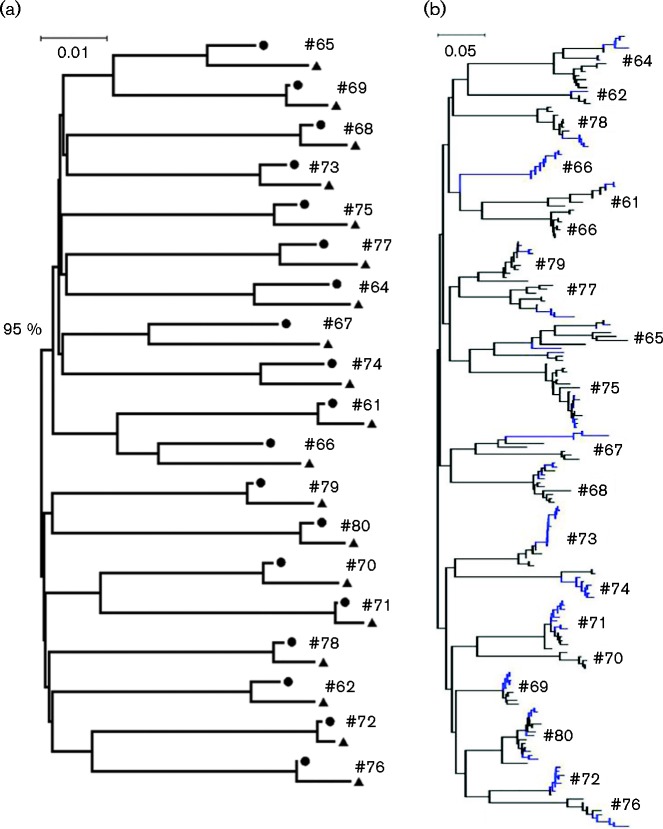
Fig. 4.
Neighbour-joining trees constructed with either HCV consensus sequences (a) or HCV HVR1 QS variants (b) under the maximum composition likelihood model and gamma distribution of rate variation among sites (γ = 0.5). Filled circles and triangles represent the HCV consensus sequences derived at the baseline and viral relapse, respectively, while HVR1 QS variants are indicated by branch colours: black (baseline) and blue (viral relapse).

