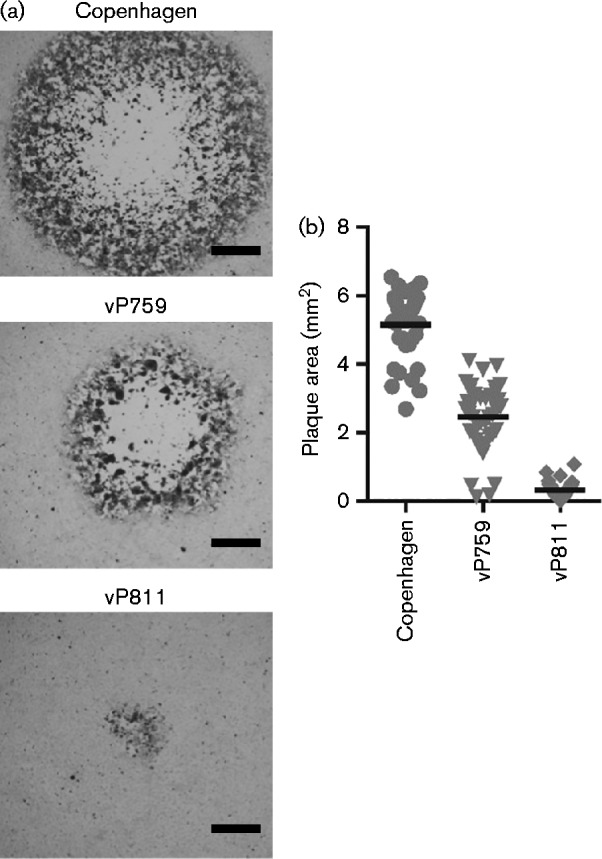
Fig. 2.

Size and morphology of plaques formed by VACV strains Copenhagen, vP759 and vP811 on BS-C-1 cells. (a) Representative immunostained plaques formed on BS-C-1 over 72 h by Copenhagen, vP759 and vP811. Bar, 0.5 mm. (b) Area of immunostained plaques produced on BS-C-1 cells (n = 40). The horizontal line represents mean plaque area. Statistical significance was determined using one-way ANOVA (P < 0.0001, n = 40) with Tukey's multiple comparison test (all pairs are significantly different, P < 0.001).
