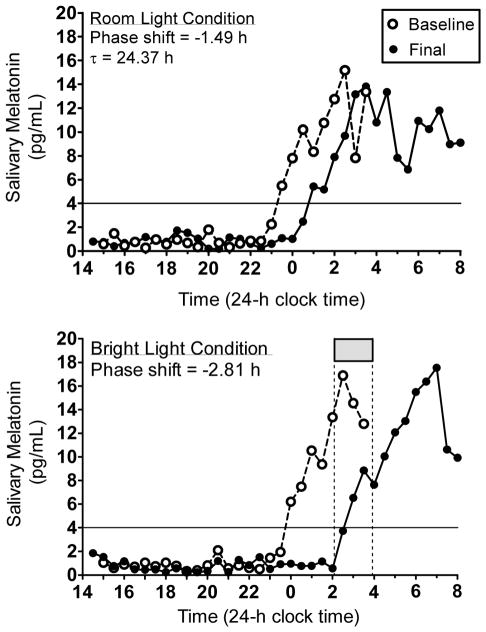
Figure 3.
Melatonin profiles. Baseline and final melatonin profiles from a 16-year old male participant during the room light condition (top) and the bright light condition (bottom). The solid horizontal line illustrates the 4 pg/mL threshold to determine the time of the DLMO. This participant was in a group in which bright light exposure (gray box and vertical dotted lines) started at 02:05 and ended at 03:55.

