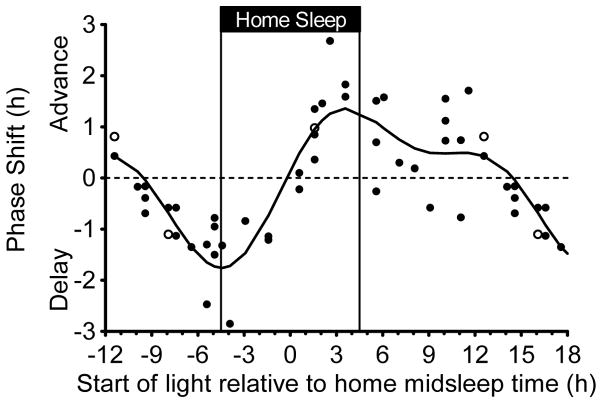
Figure 5.
Adolescent phase response curve to bright light plotted relative to the midpoint of the fixed 9-h home sleep schedule participants followed before each 5-day laboratory session. The sleep schedule was tailored to each participant’s current summertime sleep schedule and is illustrated with vertical lines. Bright light (~5000 lux) was produced with a single light box. An intermittent bright light pattern (four 20-min bright light exposures with 10 mins of dim room light (~20 lux) in between) was repeated at the same clock time for three consecutive days while participants lived on an ultradian sleep/wake (2 h dark/2 h light) schedule. DLMOs were measured before and after the three days of ultradian sleep/wake schedules and bright light exposures, from which the DLMO phase shift size (in h) and direction (advance or delay) was computed for each individual. Participants completed the same 5-day laboratory session without bright light (in a counterbalanced order) to measure the natural drift of the system due to the protocol. This shift was subtracted from the phase shift during the bright light session to isolate the shift due to bright light alone (net phase shift). Each point represents an individual’s net phase shift (y-axis) in response to when bright light exposures started relative to their schedule midpoint of sleep time at home (x-axis). Open symbols represent the three participants for whom a different DLMO threshold was used (10 pg/mL for two high melatonin secretors and 1 pg/mL for one low melatonin secretor; see text). A 2-harmonic curve was fit to the data. Phase shifts that occurred 12 to 18 h after home midsleep time are double plotted.

