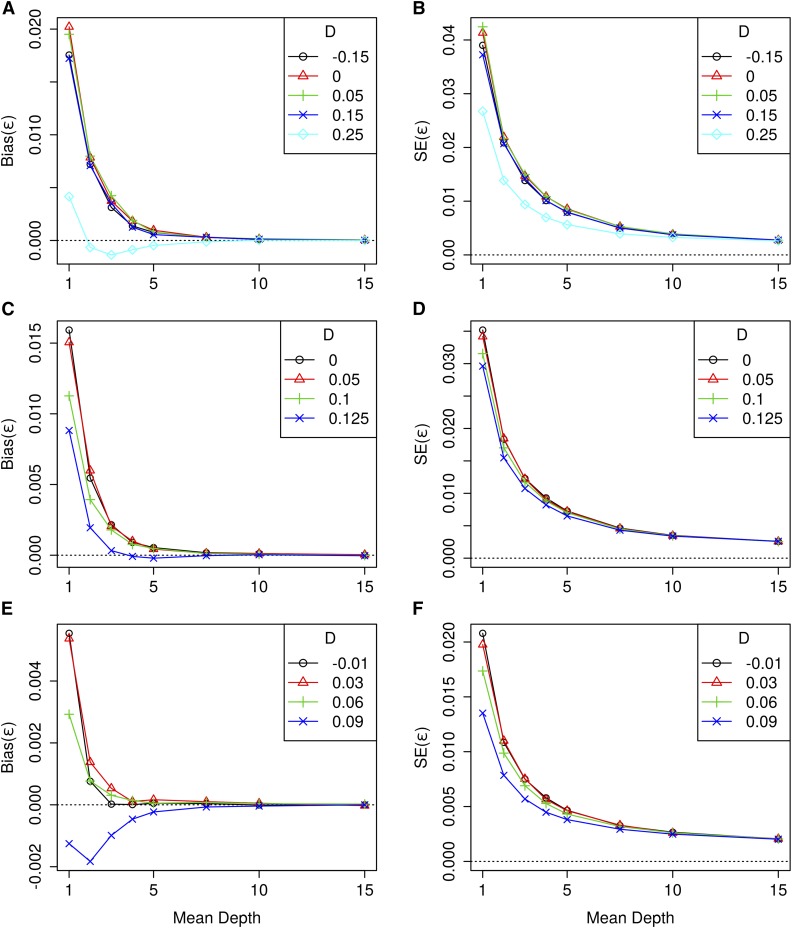
Figure 2.
Bias of the sequencing error estimates, from GUS-LD for simulation 1 (A), simulation 2 (C) and simulation 3 (E), and SE of the sequencing error estimates, from GUS-LD for simulation 1 (B), simulation 2 (D), and simulation 3 (F), where the parameters used for each simulation are given in Table 2.

